The question
Every circuit on the calendar is described somewhere as "hard to overtake at" or "good for racing", and everyone repeats it, and almost nobody has a number for it. We have an engine that simulates all 24 of them and it costs nothing to run, so the number is gettable.
So: put the quickest car on the grid at the very back, and see where it finishes.
How this was measured
Nine hundred and sixty races. Forty at each of the 24 circuits, with the fastest package on the 2026 grid started dead last and nobody else penalised.
Using the fastest car is deliberate. If a slow car fails to come through the field, that tells you about the car. With the best package on the grid, whatever it cannot recover is the circuit's doing rather than the machinery's.
One methodological note, because it changes how one column reads: races where the car retired are excluded from the average rather than counted as last. So the averages below are "where it finished when it finished", and the retirement rate is reported separately — at Las Vegas the recovery attempt ended in the wall 15% of the time, which is its own kind of answer.
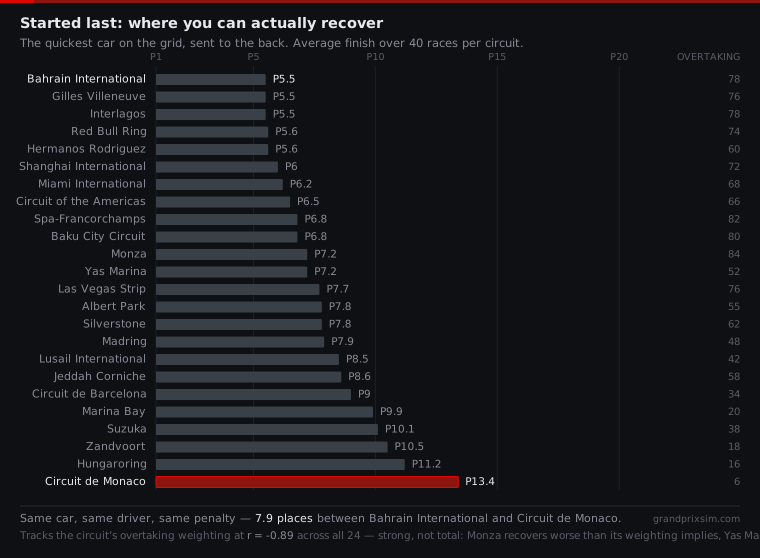
Seven point nine places, for the identical penalty
The same car, the same driver, the same punishment: P5.5 at Bahrain, P13.4 at Monaco. Three circuits tie at the top — Bahrain, Montreal and Interlagos all average P5.5 — and Monaco is nearly eight places worse than any of them.
Put that in real terms. A five-place penalty at Bahrain is an inconvenience you erase by lap 20. The same five places at Monaco is most of your race. Grid penalties are handed out as if they were a fixed quantity, and they are not remotely fixed.
From the back you do not win
Across all 960 races, a win from last happened at four circuits out of 24, and even there it was rare: Montreal 5%, Bahrain 2.5%, Interlagos 2.5%, Mexico City 2.5%. At the other twenty it never happened once.
Monaco's best result in forty attempts was P7. Not its average — its best, the single luckiest of forty races with the quickest car on the grid.
What explains it, and what does not
Each circuit in the model carries an overtaking weighting, and the ordering tracks it closely: r = −0.89 across the 24. That is a strong relationship and it is the obvious one. It is also not the whole picture, and the exceptions are the interesting part.
If you fit the finishing positions to the overtaking weighting alone and look at what the fit gets wrong, a pattern falls out immediately:
| Circuit | Overtaking | Laps | Predicted | Actual | Miss |
|---|---|---|---|---|---|
| Circuit de Monaco | 6 | 78 | P11.7 | P13.4 | +1.7 |
| Monza | 84 | 53 | P5.6 | P7.2 | +1.6 |
| Las Vegas Strip | 76 | 50 | P6.2 | P7.7 | +1.5 |
| Spa-Francorchamps | 82 | 44 | P5.7 | P6.8 | +1.1 |
| — the fit is closest in the middle — | |||||
| Yas Marina | 52 | 58 | P8.1 | P7.2 | −0.9 |
| Hermanos Rodriguez | 60 | 71 | P7.5 | P5.6 | −1.9 |
Three of the four circuits that recover worse than their overtaking weighting predicts are the three shortest races on the calendar. Spa has the second-best overtaking weighting in the whole set — 82 out of 100 — and the shortest race, 44 laps. It only manages P6.8.
Which gives the finding worth taking away:
Overtaking difficulty sets the ceiling on a recovery. Lap count decides how much of that ceiling you get to use. Being able to pass is worth nothing if the race ends before you have had time to pass twenty-one cars. Interlagos and the Red Bull Ring are not better circuits for overtaking than Spa; they are 71-lap races instead of 44-lap ones.
Monaco is the fourth in that table and it is there for a different reason: at a weighting of 6, a straight line stops describing it. Below some threshold passing does not get gradually harder, it stops, and the model reproduces that — which is why Monaco finishes 1.7 places worse than even its own dismal weighting suggests.
Going the other way, Mexico City recovers nearly two places better than predicted while retiring 17.5% of the time. When you are last, cars ahead of you retiring is help.
What it looks like watching a real race
None of this is a claim about the real sport — it is what a model does. But the shape of it matches something you have probably noticed and not had words for:
- A penalty is a circuit-specific sentence. Ten places at Monza and ten places at Monaco are not comparable events, and treating them as the same number flattens the thing that actually decides the weekend.
- Qualifying matters most where passing is hardest. Obvious once stated, and it is why Saturday at Monaco and Hungary carries a weight that Saturday at Bahrain does not.
- A short race protects the front row. The races that end soonest are the ones where being behind is least survivable, whatever the layout allows.
Try it yourself
All of this is a button on this site. The race predictor takes a grid penalty and runs thousands of simulations with it, so you can put any driver at the back of any circuit and read the distribution rather than one result. There is also a Grand Prix simulator if you would rather watch a single race play out lap by lap and see where the recovery stalls.
The championship simulator has eight scenarios built on exactly this, one of which is Monaco from last place. Now you know what you are up against.
The honest limits
This is a simulation, not a measurement of reality. The circuit weightings and driver ratings are our own model rather than official data, so what you are reading is what this simulation believes, and the model is written up in full if you want to check the reasoning. Forty races per circuit is enough to separate P5.5 from P13.4 and nowhere near enough to argue about a tenth of a place — the three circuits tied at P5.5 are tied, not ranked.
Questions
Which F1 circuit is hardest to overtake at?
Monaco, by a wide margin. Starting the quickest car on the grid from last place, it averaged P13.4 over 40 simulated races and its single best result in all of them was P7. The next hardest are Hungary at P11.2 and Zandvoort at P10.5.
Which F1 circuit is easiest to overtake at?
Three tie: Bahrain, Montreal and Interlagos all bring the quickest car from last to an average of P5.5. The Red Bull Ring and Mexico City are a tenth behind at P5.6. All five are long races on layouts with real passing places.
Can you win from last place in F1?
In this model, barely. Across 960 races a win from last happened at only four of the 24 circuits and never more than 5% of the time even there. At the remaining twenty it never happened at all.
Why is Monaco so hard to overtake at?
The layout gives almost nowhere to pass, and the model's overtaking weighting for it is 6 out of 100 — the lowest on the calendar. What is less obvious is that being a long race does not rescue it: Monaco is the longest race of the 24 at 78 laps and still the worst place to start badly, because laps only help if passing is possible at all.
Does a longer race make it easier to come through the field?
Yes, and it is a bigger factor than it looks. Three of the four circuits that recover worse than their overtaking weighting predicts are the three shortest races on the calendar. Spa has the second-best overtaking weighting in the set and the shortest race at 44 laps, and only reaches P6.8. Overtaking difficulty sets the ceiling; lap count decides how much of it you use.
- F1 Career Simulator — one driver, karting to Formula 1.
- F1 Simulator Game — a single Grand Prix, lap by lap.
- F1 Championship Simulator — a full 24-round season, or run a team.
- How the simulation works — the model, in detail.